Creating the digital SS Conegeek
The next step in getting the simulations running is building a digital model of the SS Conegeek, the name to no surprise is because sometimes, on an autocross course, the Challenger SXT will feel more like a boat than a car. For this, if you have scales and actual dyno plots from your car you will get a very accurate model. Since my car is stock, I mainly used the information available online to build this.
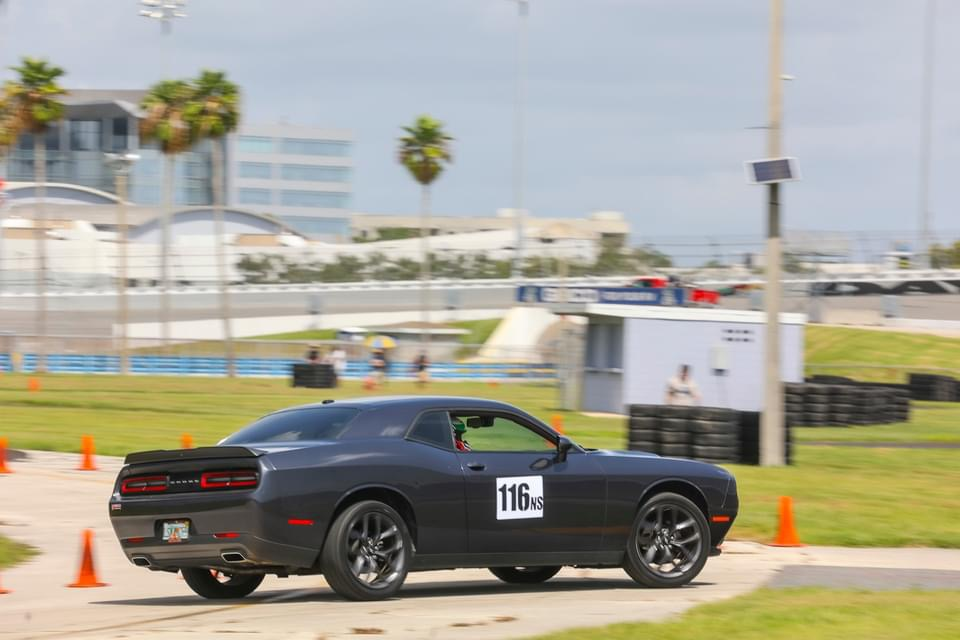
Photo of the SS Conegeek in Daytona, taken from CFR SCCA Autocross Facebook group.
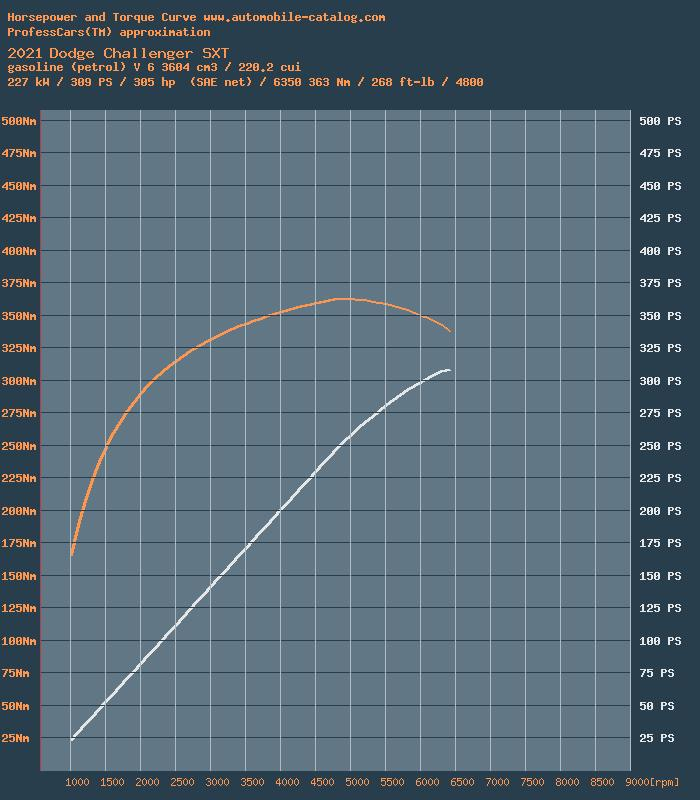
The first step is obtaining a power curve. Optimum lap allows for multiple unit systems to be used, but in reality, anything other than metric is clunky to use, so get your calculator out. I found this curve online for the 2021 Challenger SXT with the Pentastar V6, which shows a maximum power of 305hp at 6350 rpm and a peak torque of 363Nm at 4800 rpm
.
You also need the car’s weight, drag coefficient, frontal area, and the size of the tires you’re using.
We estimate the car’s downforce(lift) coefficient at -0.5.
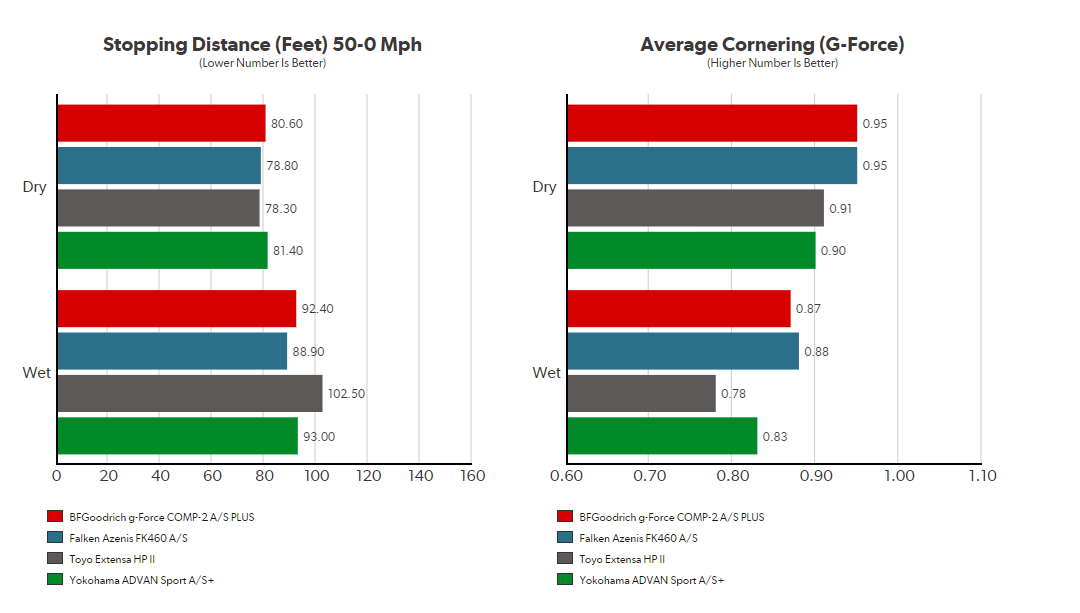
Then we need to set the maximum lateral and longitudinal tire friction coefficients for the car. These are probably the most important parameters. Tire Rack has performed many tests on the BFG G-FORCE™ COMP-2 A/S PLUS that we’re running on the car. The lateral is mentioned in the tests as 0.95G and the longitudinal we can calculate with a little physics from the 50-0 braking distance we obtain a friction coefficient of 1.02G.
Once this is done, we can get some interesting information from the car by using Optimum Lap’s car report:
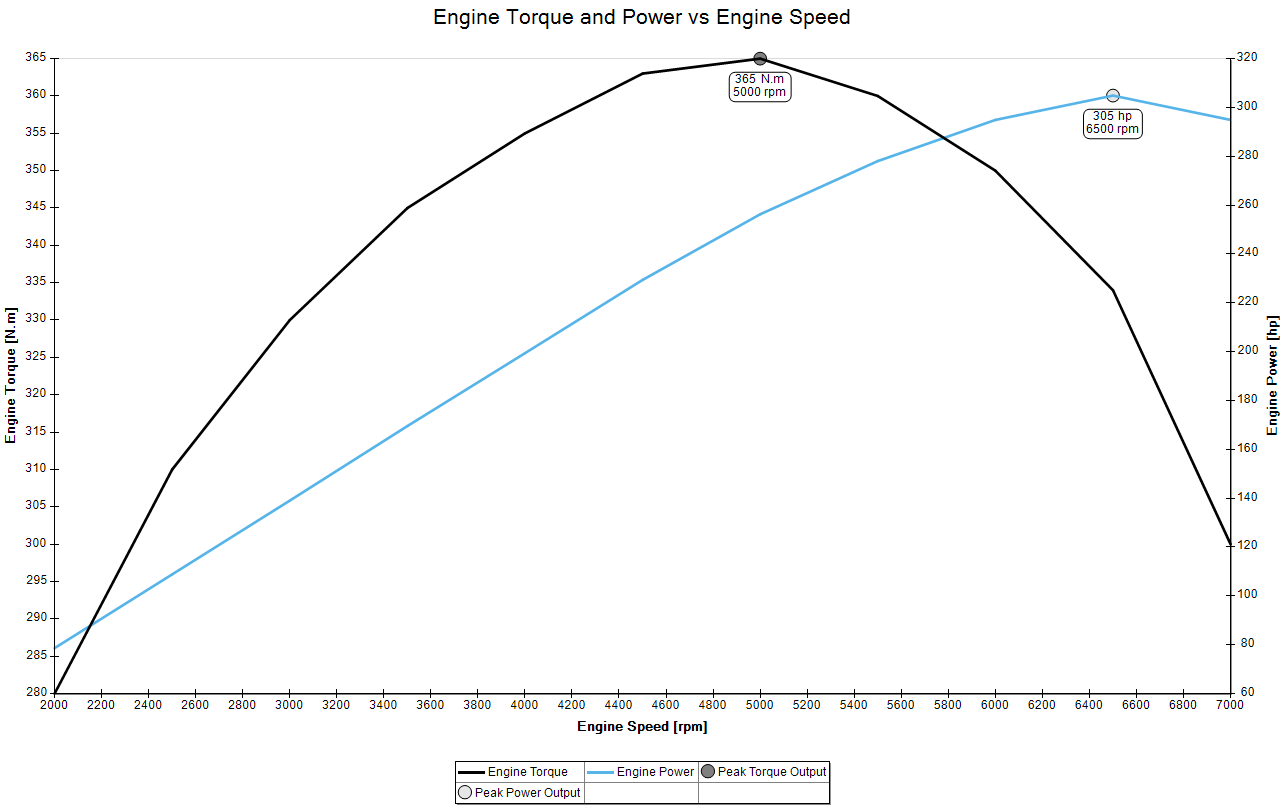
The first thing is the power curve, which we already had, but is still useful.
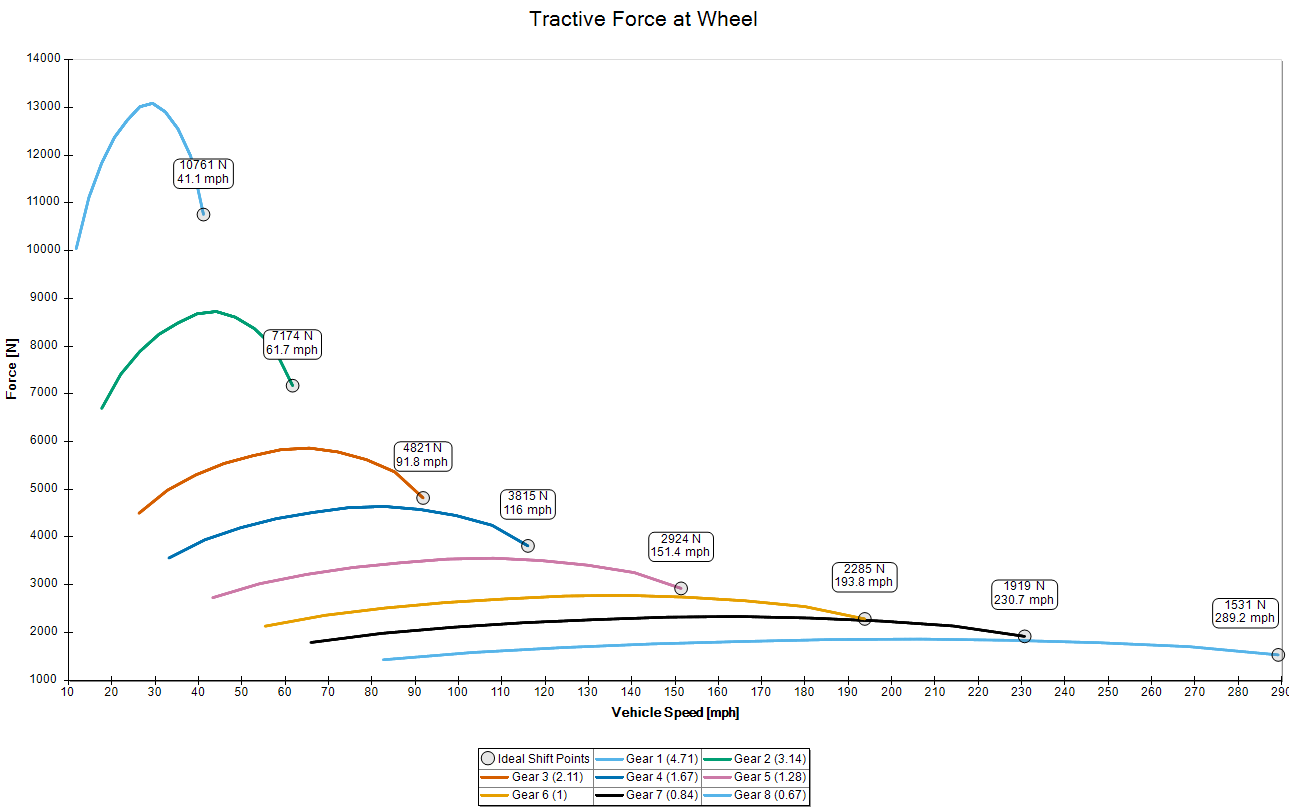
The second graph shows the tractive force at the wheel. This is interesting because it shows the calculated ideal shift points for each gear and the force on the wheel as the speed grows. As we can see, between the first, second, and third gears, there are big gaps between them. This means that the car loses a lot of force on the wheels when upshifting. We can evaluate mods like switching final drives on this graph.
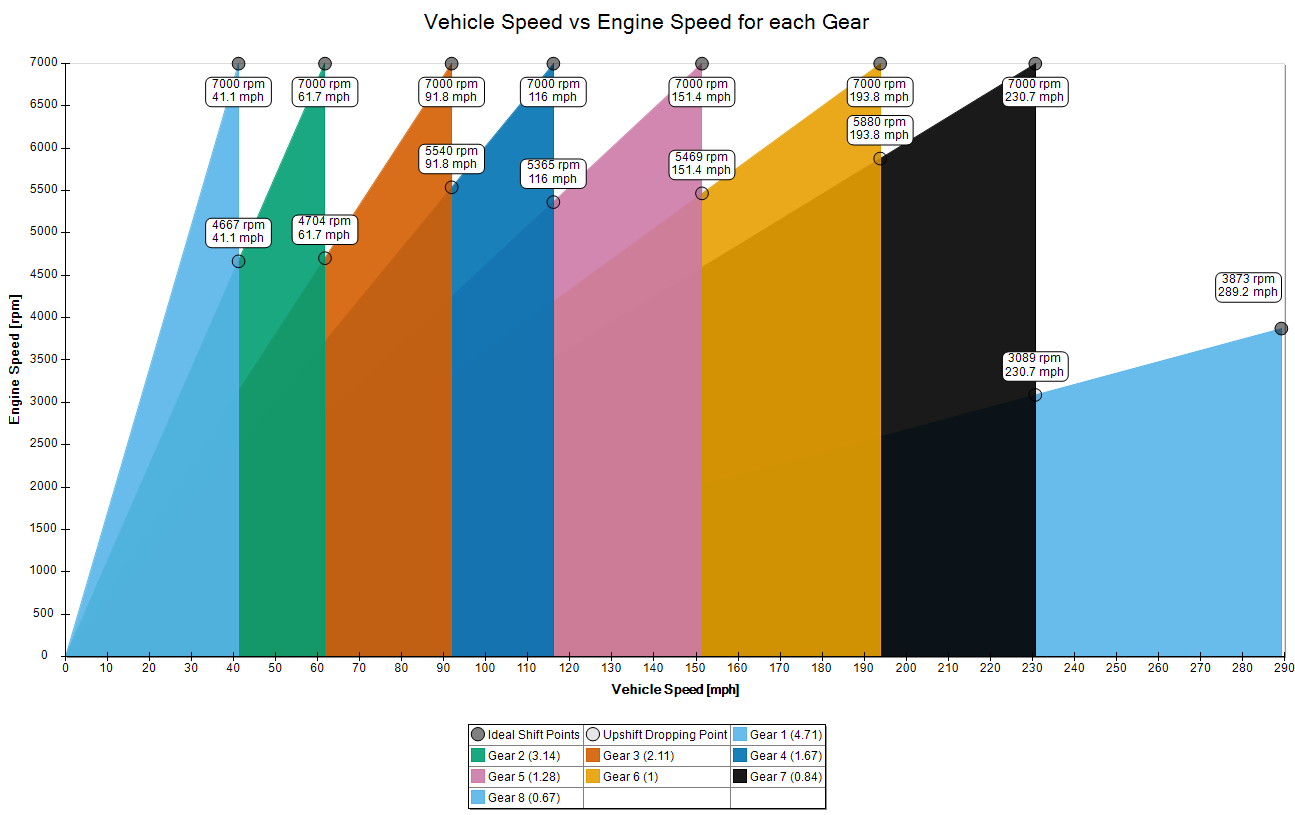
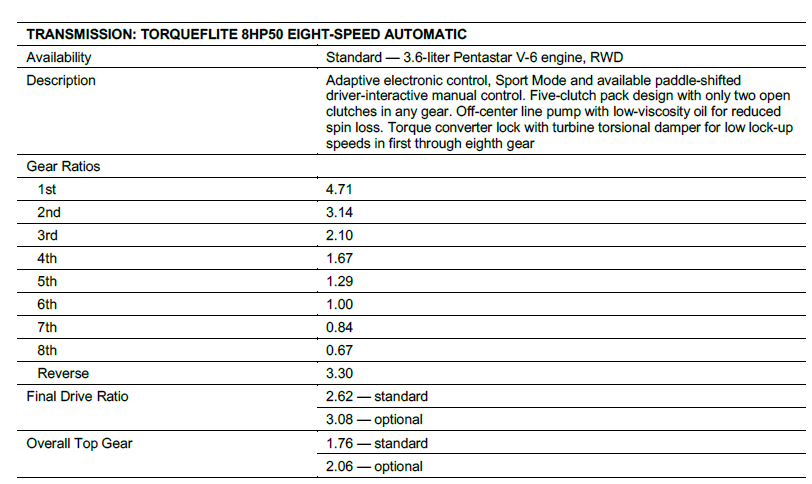
Then we get the gear ratio graph. This is useful to see the RPM drop when we shift. And to check our gearing and ideal shift points.
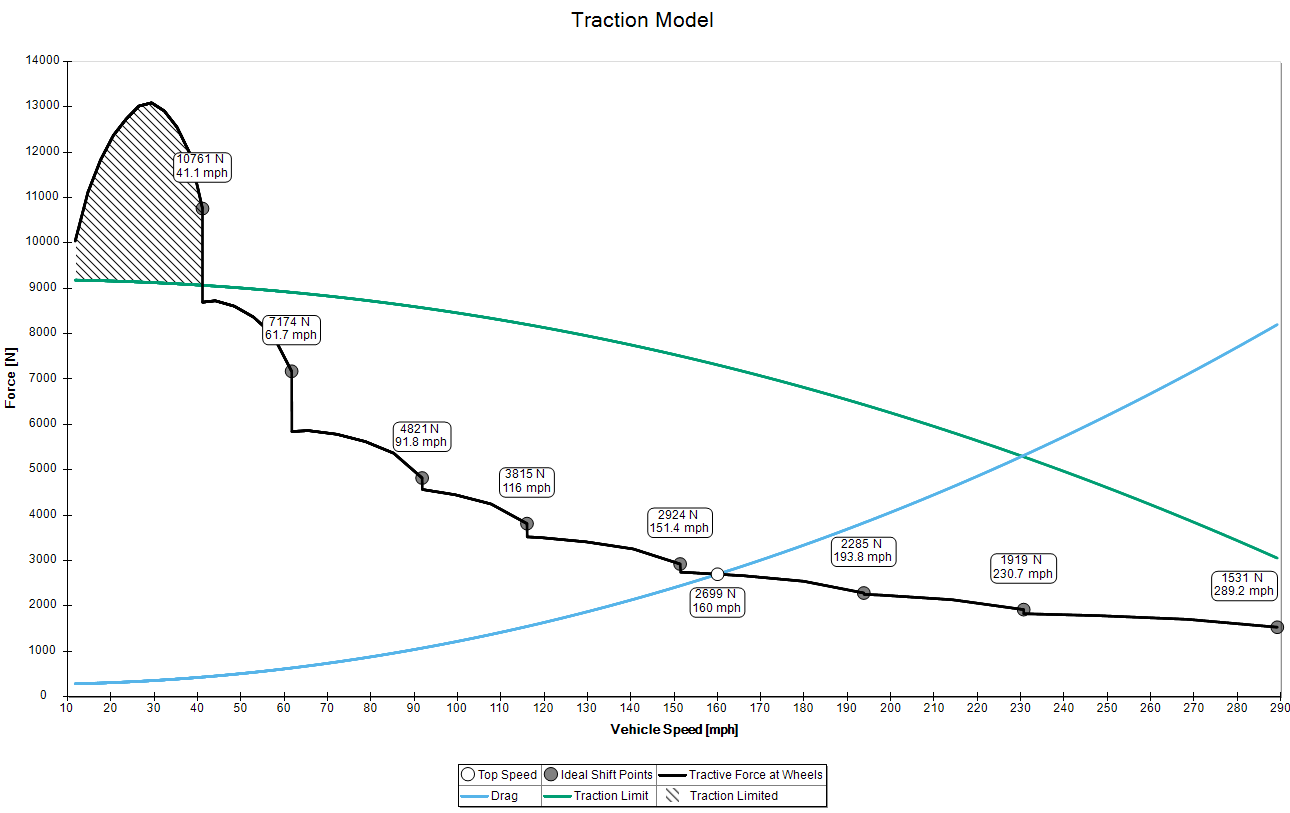
The next one is the traction model. It is a more sophisticated version of the first graph. It shows the areas where the car's traction is limited (It can spin its wheels). In the case of the V6 on the SS Conegeek, we see that we’re traction-limited in first gear. We can also see the aerodynamic force rising and when it crosses the tractive force curve, we have our car’s max speed.
The final window is the vehicle summary which is pretty useful to get some basic stats on your car.
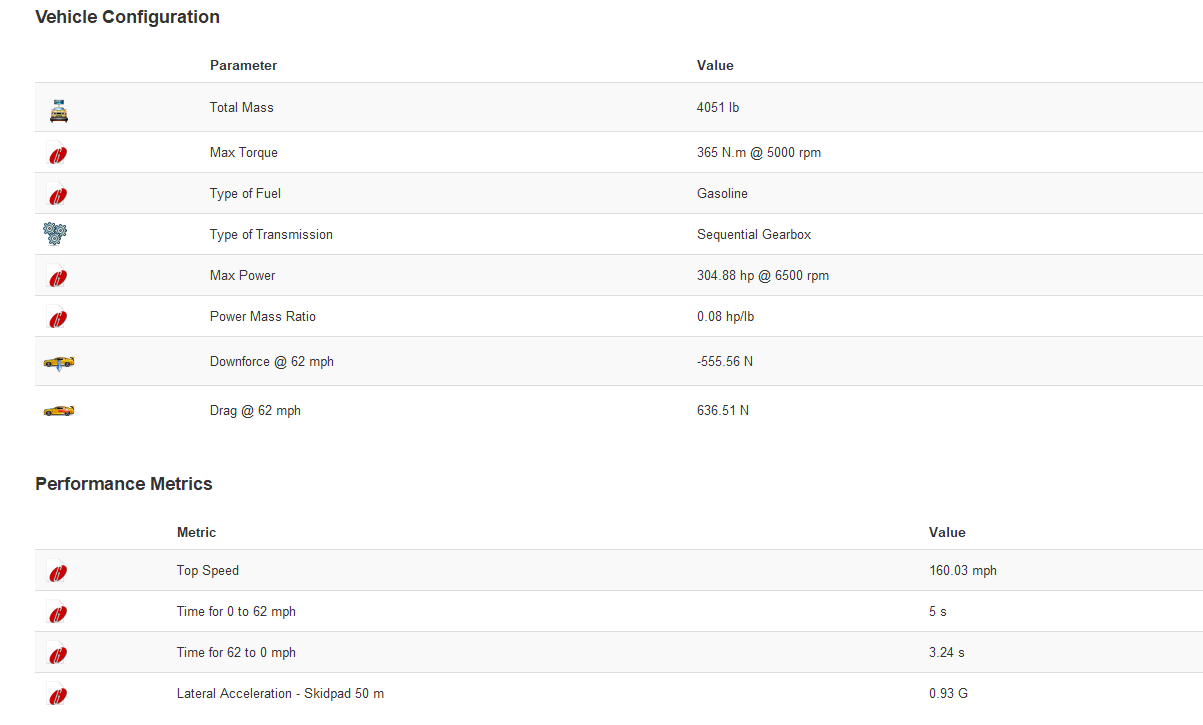
Interestingly the 0-60 time calculated is very similar to the one quoted by the manufacturer.
Now that we have a digital car and a digital track, we can get into the fun task of knowing what are the car parameters that will provide the most time gains, which we will on the next post.
Useful Links:

Comments
Post a Comment